

Thanks to the growing digital data streams generated by construction, we're seeing an increase in practical applications of data analysis. One of those is in supply chain management. It's no surprise that price has traditionally been the sole factor considered when selecting construction contractors, it's easy to measure, can be exactly defined in a contract, and can be tracked during project execution (usually in the form of huge overruns!). But more complex projects are considering a variety of other performance indicators when awarding contracts, including:
- Qualifications
- Schedule
- Quality
- Safety
The goal of using this selection process, sometimes referred to as the "Best Value Model" is to minimize project risks and to enhance long term performance and value of the built facility. A client will invite qualified vendors to bid. Once selected, the vendor(s) will create a project specific risk plan. Then, during the project, the client will track performance according to the risk plan and require regular reports. This performance can be logged and consulted again when awarding future contracts.

Weighted multi-criteria subcontractor scoring
One big challenge when awarding contracts based on this approach is that the additional performance dimensions are much harder to objectively measure than price. How do you track past schedule compliance? What indicates a contractor’s relative safety record? During execution, a client may doubt the reliability of progress reporting from the vendor. Luckily, the digitization of construction information is beginning to give us objective indicators of subcontractor performance. Lets consider some practical examples:
Example 1: Short term planning and coordination of trades. In projects using theLast Planner System of lean production planning, subcontractors are required to commit to a detailed series of tasks which they will complete in the coming week. If they do not deliver the work by the promised date, the committed activity will be recorded as incomplete. Planned Percent Complete (PPC) is a score measuring the percentage of completed activities out of the total committed activities, and is tracked as a measure of planning reliability.
Example 2: Safety Compliance. As structured, safety inspections are recorded digitally, measures of compliant vs. non-compliant observations associated with particular subcontractors can be analysed. On a growing number of sites with biometric access control, this can be further analysed per man-hour per subcontractor.

Safety dashboard showing incidents per 1000 man-hours worked for a particular subcontractor across 5 projects
Example 3: Resolution of design review and on-site issues. When an issue such as a costly clash between a structural element and service duct is identified in a 3D model environment it can be assigned to a responsible party, communicated in a shared model and tracked through to resolution. Both the total number of such clashes, and average time taken for satisfactory close-out can be measured and analysed per consultant engineering firm in a project. Likewise, the number of issues and observations occurring onsite can be quantified per million $ of contract value and similar subcontractors can be ranked against each other, resulting in a measure of quality compliance.
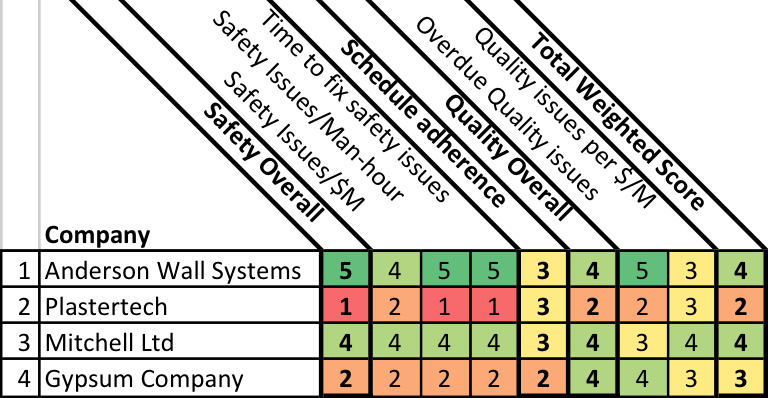
Summary performance dashboard of drywall subcontractors in a geographic region, scored across key dimensions
The Importance of Data Quality. Remember the old adage: garbage in, garbage out. Slick, convincing looking business intelligence (BI) dashboards can support catastrophic failures in human decision making if they're backed up by erroneous or incomplete data. We need structured quality assurance at all phases of data collection and analysis to ensure reliable decision making. This includes:
- Large enough data sets to draw statistically meaningful conclusions
- Consistent adoption of the construction management tools (our sources of data) across the supply chain
- Filtering of data to remove anomalies and inconsistencies
- Industry standard operating procedures with regards to data management across projects
Creating a Framework for Performance Evaluation. Once we can ensure that quality data is being reliably collected and analyzed, we need to agree on the dimensions of subcontractor performance evaluation. The importance of carefully defining these KPIs cannot be overstated – they affect the supply chain management, strategic and operational planning of a company.
There must also be a clear process in place for interpreting the results of KPIs at all levels within an organization. Consider, for example, a seasoned project manager who consults the results displayed on dashboards to conduct monthly reporting on supplier performance in adherence to quality, safety, schedule and cost. How can this PM’s report, which is after all an aggregation of insights offered by the BI tools combined with the knowledge derived from years of experience on multiple projects, be filtered up into a cross project scorecard that can be presented to a supply chain manager?
Some other important questions to consider: What is the consequence of a score below a certain threshold in a critical area? Do subcontractors have regular score reviews, after which they can are promoted to or demoted from a “top league” of vendors who can be invited to tender on high risk projects? Is the overall pool of potential vendors examined on a project specific basis, based on the performance criteria deemed critical for that project’s needs?
Where Do We Go From Here? This post outlines a framework for data-driven supply chain selection in construction, outlining some of the KPIs currently available for analysis, and highlighting some of the data quality concerns that need to be addressed to surface truly useful to useful insights to contractors. It is still early days for contractors and clients as they incorporate data analysis and BI into their decision making processes. But as data sets grow larger and more comprehensive, we can expect that data-driven supply chain selection will be more commonplace in project procurement strategies. As BI analysis techniques become more sophisticated, we'll begin to develop techniques for identifying correlations of key risk factors based on machine learning and predictive analytics.
This article was originally posted on LinkedIn Pulse by Michael Moran on 2 Nov, 2016


